
Visualizing the 2d World with Cartograms
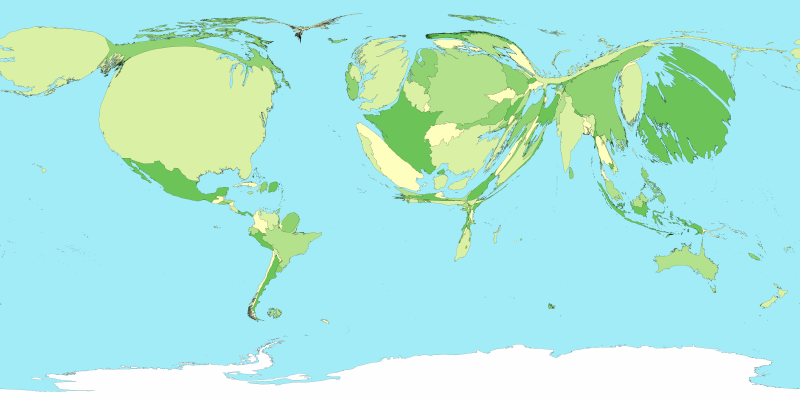
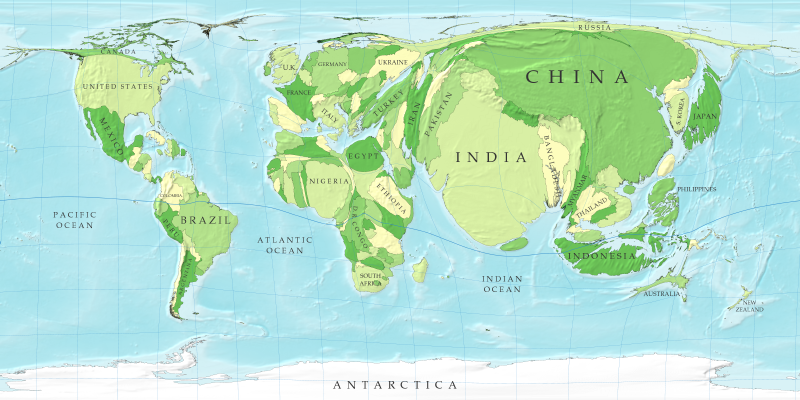
Space and time are favorite subjects of mine, since they are the root concepts for two of the most fundamental types of questions we can ask, where and when questions. I discussed three dimensions in detail in a previous post, so I am going to dive into the subject of cartograms and show why you should be careful about your two-dimensional thinking as well. I'll give you a question to stick behind your ear before I begin: how do tiny island nations like Britain and Japan manage to dramatically influence the world, while huge continents like Africa and South America often don't even register on the radar? Let me warn you right now, that's a trick question.
We live on a sphere. Since we don't really think effectively in 3d, we invented maps. You probably know that the common Mercator projection distorts the areas of countries, while roughly preserving their shapes. You might also know that there exists a projection called the Peter projection, or "equal area" projection, that corrects the area distortion at the expense of introducing a shape distortion. The latter is a favorite of super-liberals, since a side-by-side comparison of the two projections will usually show startling West-East and North-South biases, lending credence to claims that the Mercator projection is racist (simple example, Mexico is vastly bigger than Alaska, but looks the same size on the Mercator projection, India is almost the size of all Europe, but looks no bigger than Scandinavia). Personally, I found the Peter projection an intriguing curiosity when I first encountered it on the wall of the bathroom of a vegan co-op I was living in at the time, in Ann Arbor (yes, the place was a hippie cliche of sorts), but I somehow couldn't see how the Mercator distortions really mattered that much.
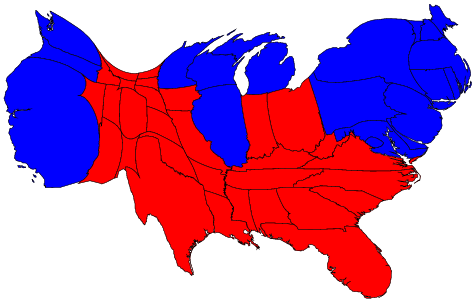
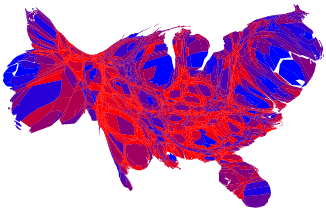
I understood why I was under-whelmed by the Peter map when I encountered cartograms. The inevitable distortions introduced by flattening a sphere pale in comparison to the distortions introduced by the ways in which we use maps to represent other geospatial information. It turns out that when you are talking about things like population with the aid of maps, it is important that your maps be wildly inaccurate. Cartograms were invented by Michael Gastner and Mark Newman of the University of Michigan as a way to visualize the results of the 2004 US Presidential elections. In particular, they wanted to show why the race was so close even though maps of red vs. blue states were overwhelmingly red. To do this, they invented a clever diffusion algorithm that distorted geography in proportion to population density, so that the voting pattern in the election looked like this, by state (these graphics below are from Mark's election 2004 page, used per his permissions on the page).
6 Comments
Here is one trivial solution:
An image which updates itself based on where your mouse pointer is on it. The mouse pointer would denote one of the two points, and the "bloatedness" of each area on the rest of the map would be proportional to the "strength of its connection" to the first point. So the map would keep distorting with various sections bloating and deflating as you move the mouse pointer (assuming of course the variations are kind of continuous and not discrete). It would be like watching the map under water with waves that distort your view of it, as you move the mouse pointer.
I call this solution trivial because it is not a static image representation of the data, but it still might be a helpful tool to visualize the data. It is just an attempt to reduce the (point on 2D surface) mapped to (point on 2D surface) to the original problem.
Hmm... not a bad start. Am having trouble visualizing this though. Reminds me of the Beltrami projection to visualize hyperbolic space, which I'll write about shortly when I launch my series on Roger Penrose's "Road to Reality."
I think it would be simpler to work with discrete graphs, that's why I suggested cities represented as points. I'd start with imagining pins poked into a rubber ball and exerting forces only at the pins.
There is that whole class of methods from visualizing abstract graphs too, mostly using some sort of rubber-band tension among the nodes. The trick to porting that to a sphere is how to deform the non pin parts.
Very interesting use of maps. I think you have got the cause-effect wrong at "we use maps because we cant think effectively in 3D". Rather, maps make sense to be 2D when they are local, because locally the earth is 2D (maps predate Spherical Earth). The move from local to global keeping the same dimension is logical and of course helped by the fact that they are more easily carried around, set on a large table and studied, etc than a globe. It is because we use 2D medium that we cant think effectively in 3D is my take on it. Also is Mercator around at all? Even my kid atlas had the sinusoidal projection (which Wikipedia tells me is the same as Mercator equal area, also apparently Mercator himself used this one and not the crappy "Greenland is bigger than Africa" one).
Hmm... I do remember original Mercator as a kid. Most maps I see still show Greenland comparable to Australia (not Africa!). The Peter projection does look radically different from most maps I see, though I don't buy the politics of the thing.
Related but not directly:
http://www.smashingmagazine.com/2007/08/02/data-visualization-modern-approaches/
There is a whole body of literature on geographic visualization. If you want a "how to" handbook look at "Some Truth With Maps" by Alan MacEachren. If you want the theory behind it, look at "How Maps Work" (also by MacEachren). You can also visit the GeoVISTA website at Penn State.